


Table of Contents
Author | Raquel C. Pico
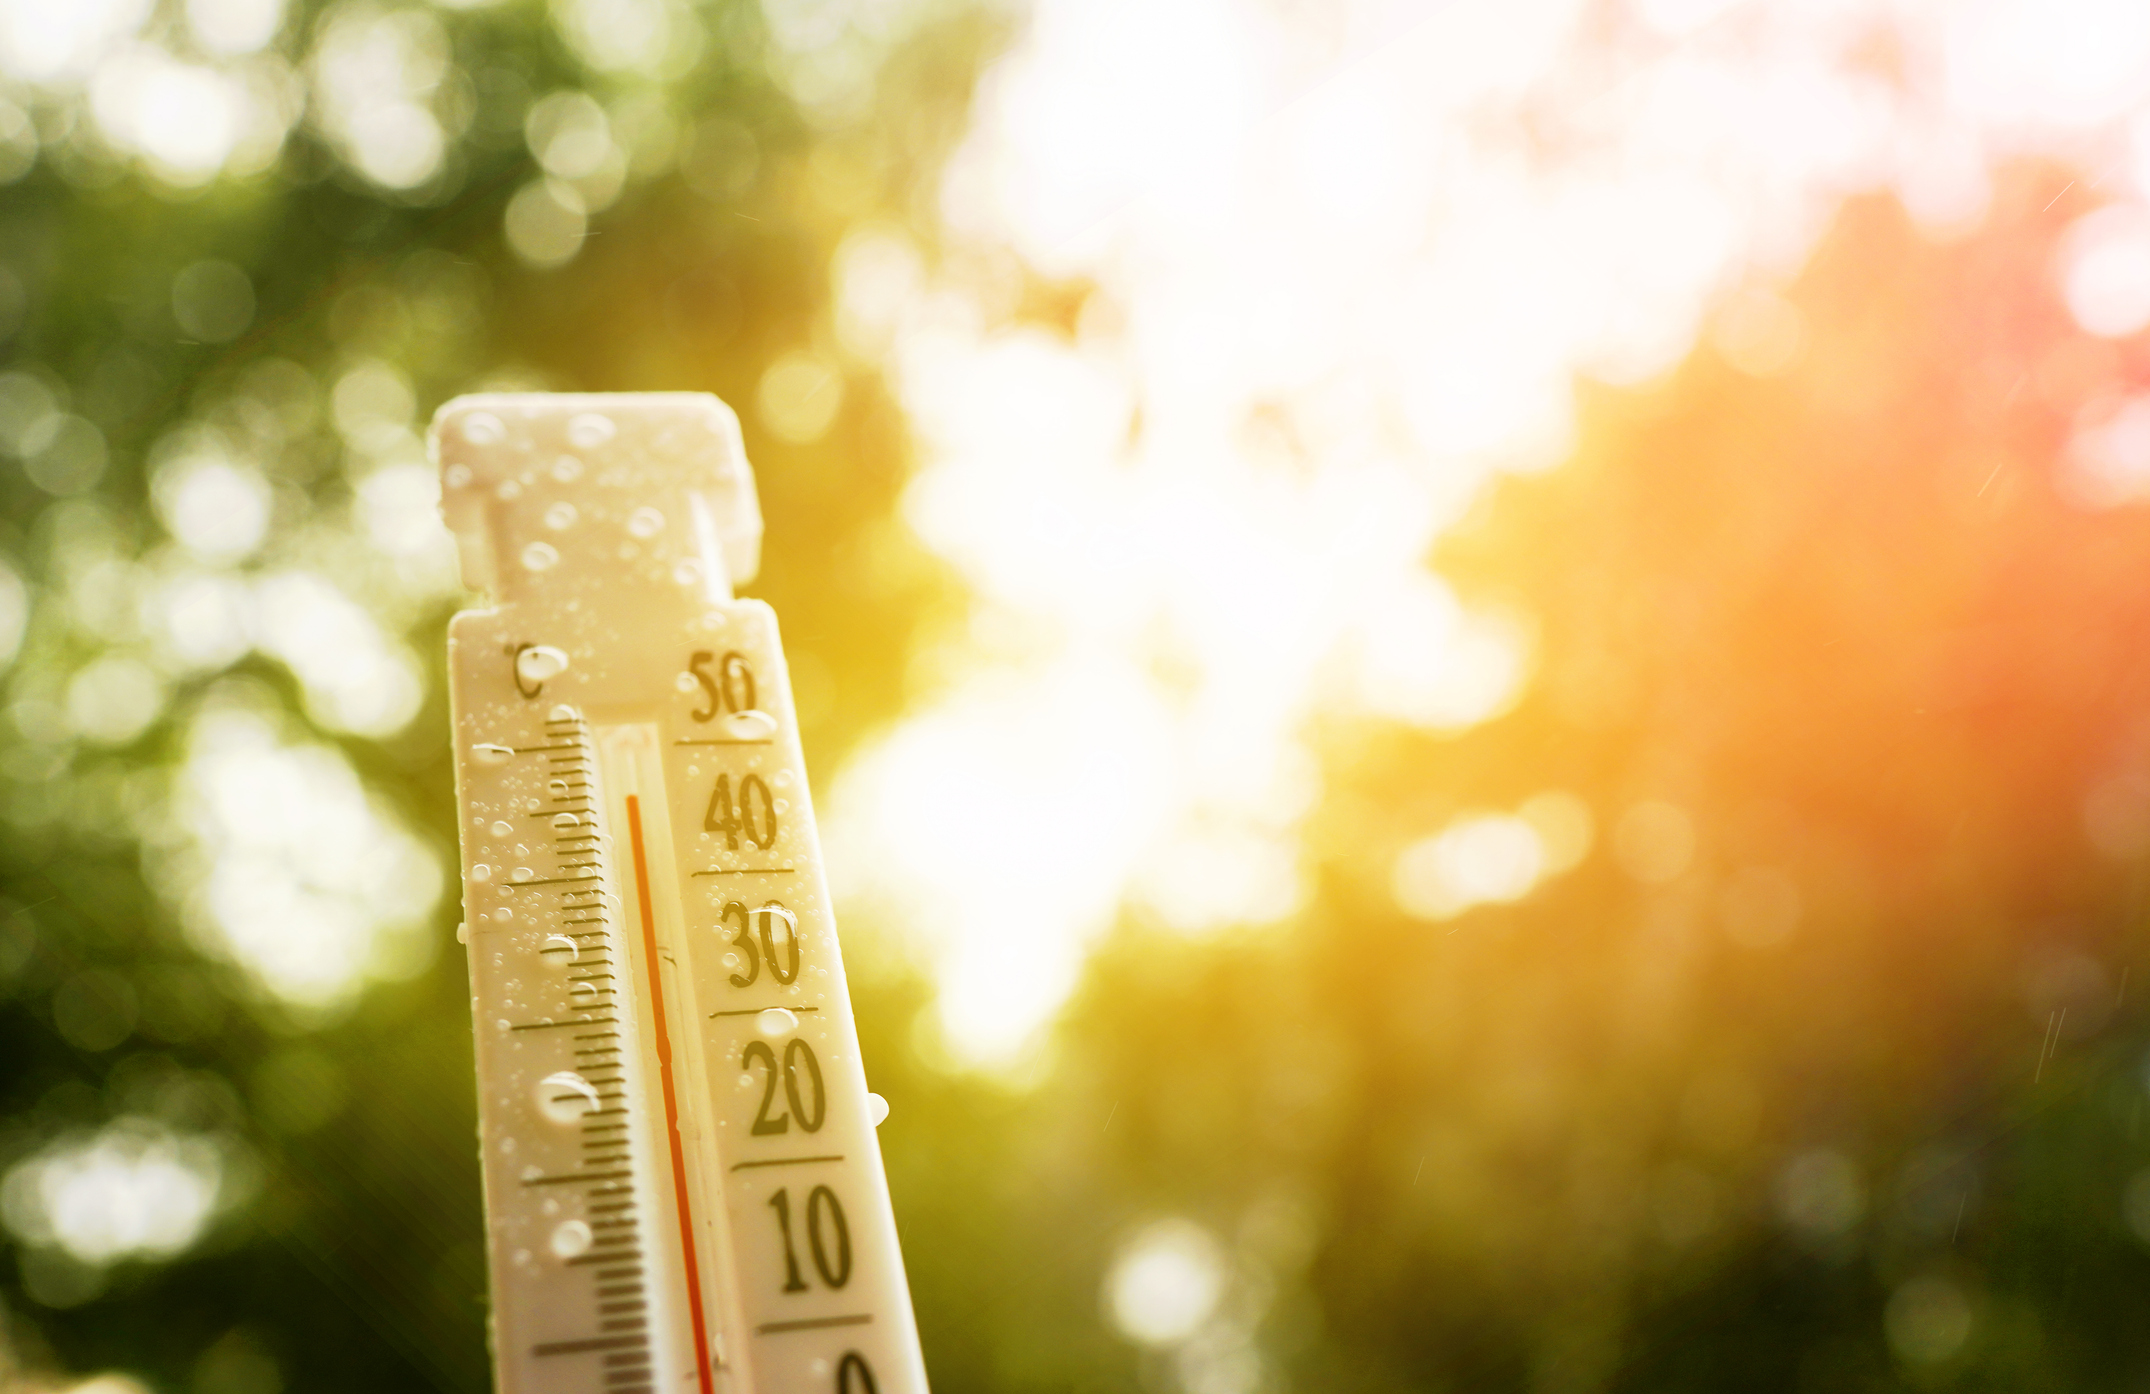
Climate change has made extreme weather events more frequent, leading to one heatwave after another during the summer. Cities are particularly vulnerable to their impact, as 20th-century urban planning has created heat islands, reduced green spaces, and consequently lowered residents’ quality of life.
Some estimates already suggest that around 489,000 deaths occur each year in cities due to the effects of heatwaves, in addition to related hospitalizations. Economic losses are also recorded, resulting from the disruptions caused by extreme heat. Its effects are being felt across a wide range of sectors, from construction to tourism. Meanwhile, records indicate that recent years have been the hottest on record and, as reported by The New York Times, global temperatures over the past year have been between 1.41 and 1.47 ºC (according to different measurements) above the preindustrial average.
This underscores the need to make more efficient decisions, conduct risk management, and rethink the city. Urban planning and green strategies are key, but they require a clear understanding of what needs to change and how to do it.
Technology to combat heatwaves

This is where technology can play a fundamental role. Mapping tools are already helping to understand settlement patterns (and provide deeper insight into urban development in Africa, for example) and smart city projects have optimized everything from traffic to irrigation management, among many other areas. Artificial intelligence has already improved urban life. Software applications, data analytics, and AI could also transform how high temperatures and their effects are managed.
Cool Cities Lab, mapping extreme heat
The WRI Ross Center for Sustainable Cities has just launched Cool Cities Lab, a mapping tool focused on understanding the extent of heatwaves and, above all, identifying vulnerabilities in urban areas. “Cities can’t afford to treat heat as a future problem,” says Rogier van den Berg, the center’s global director. “It’s already reshaping daily life and putting people in danger.”
The tool is a mapping solution that moves from broad insights to detailed analysis. Through data management, it delivers highly granular results. It can assess how heat impacts areas at street level and even street by street, helping to visualize where the greatest risks occur during each heatwave.
One of its key features is the ability to share data, which in turn supports better decision-making across different sectors and scenarios. In other words, it not only enables city governments to understand where to plant trees or deploy more cooling solutions, but also helps guide infrastructure development, for example. “Actionable data is essential for responding to this growing threat,” van den Berg emphasizes.
How the mapping tool works
The solution is open source, and urban leaders themselves have been involved in its design. It is currently operating with data from 25 cities around the world, ranging from Barcelona to Buenos Aires, including Boston and Nairobi. However, it could be applied to many other cities, as it is scalable.
The data helps build models that evaluate potential solutions to the effects of a heatwave. This provides a clearer picture of likely outcomes before any real investment is made. It is not just about improving risk management, but also about achieving greater efficiency and delivering a tangible improvement in people’s quality of life. At the same time, it helps identify the most vulnerable areas, both in terms of heat exposure and access to resources that can mitigate the negative effects of high temperatures. With this data in hand, neighborhoods and streets can be prioritized, and more effective solutions can be implemented.
In this context, the mapping tool addresses one of the main challenges faced by heatwave solutions. As explained in an analysis for the development of a dedicated software application in France, having data is not enough, because the information is “rarely actionable or formatted for practical use.”
Why it matters
Beyond addressing a critical issue, this mapping tool has already demonstrated its potential as a solution to heatwaves and their effects.
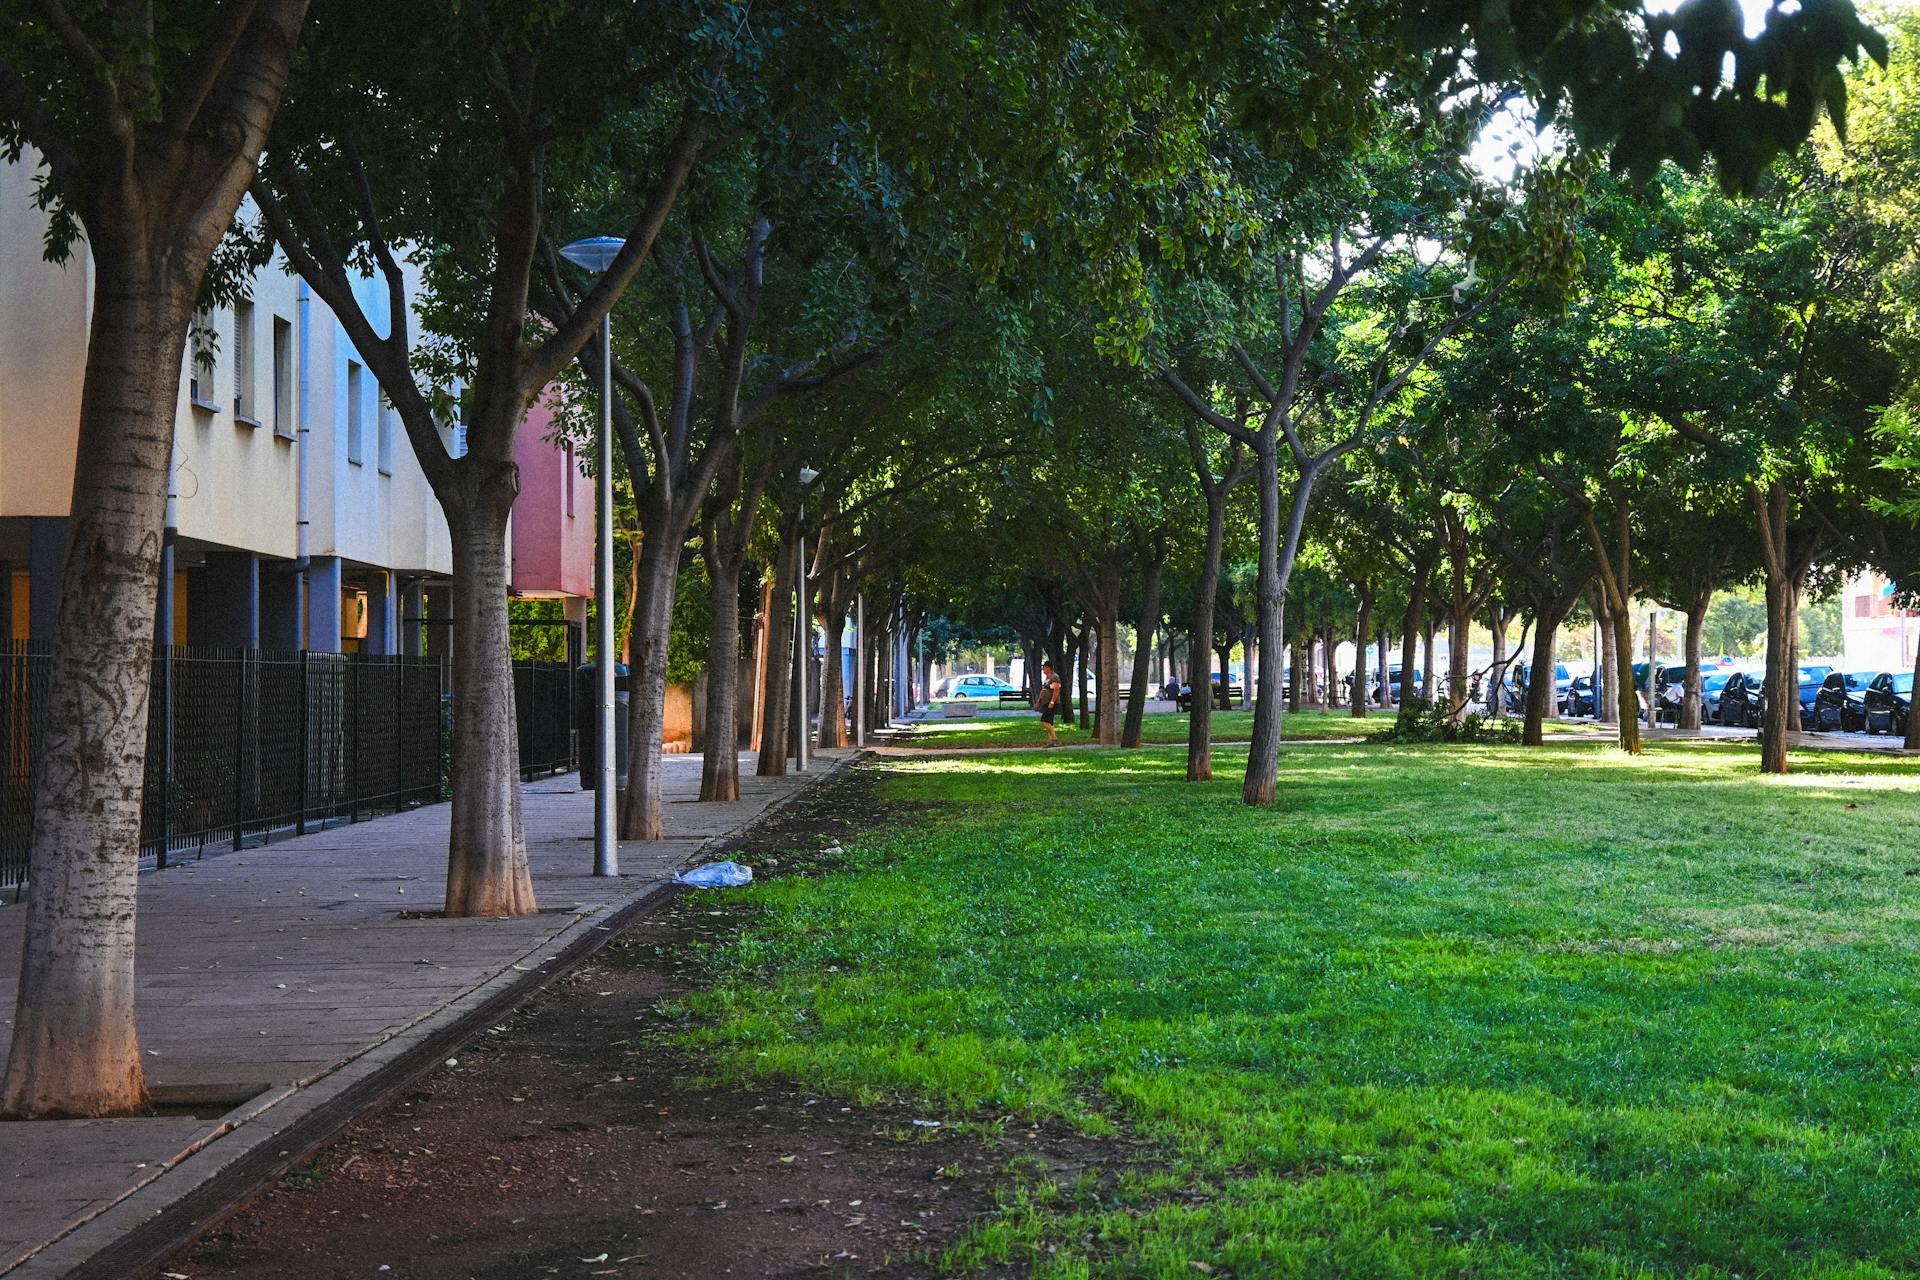
1. More trees
Thanks to a 20% increase in the number of street trees, Campinas (Brazil) reduced temperatures by between 1.7 and 1.8 ºC and created “walkable cool routes.” In Hermosillo (Mexico), data from the mapping tool identified the vulnerable area that needed green space.
2. Better combinations
A clearer understanding of what works, and where, helps enhance the cooling effect of these solutions. In Cape Town (South Africa), they found that the cooling effect could be doubled by combining trees with heat-reflective roofs.
3. Policy changes
Cities can also adjust municipal regulations to achieve more positive outcomes.
Photos | Peter Caretta, Maksim Safaniuk/iStock, AndresGarciaM/iStock


